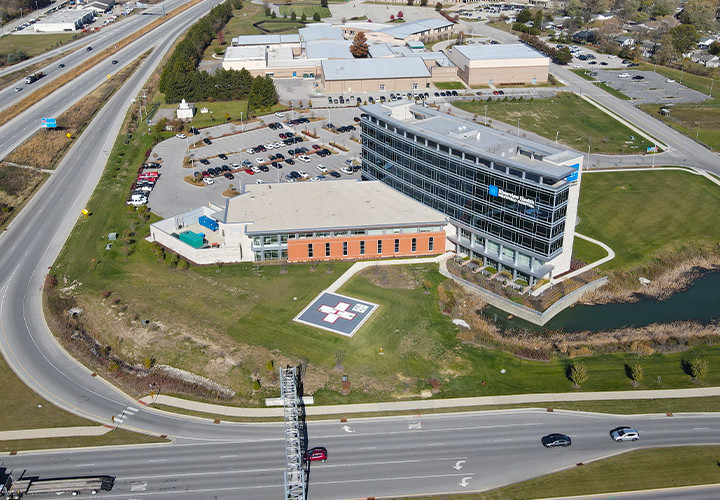
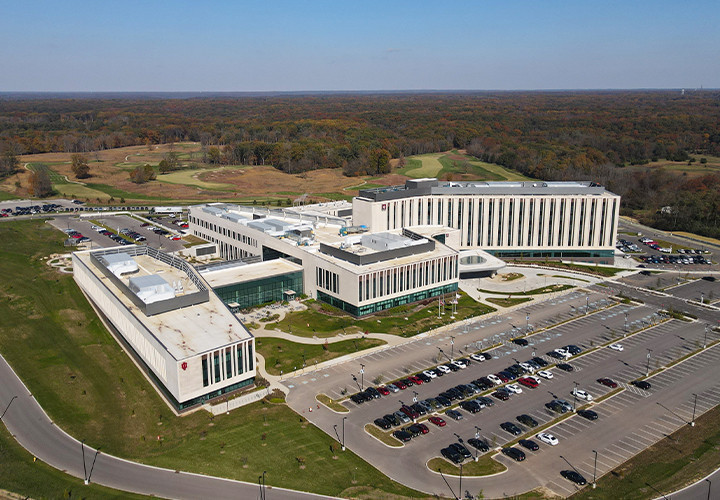
Located in Shelbyville, Indiana, Major Hospital was due for a major upgrade. In fact, the old hospital was demolished entirely, and CMTA was brought in to lead efforts to create an energy efficient facility that the region could be proud of.
Project At A Glance
Size: 299,000 Square Feet
Cost: $88,000,000
Completed: 2016
Modeled Energy Use: 125 EUI
Performed Energy Use: 123 EUI
Carbon Reduction: 1,820 MTCO2e Annually
Geothermal Piping: 1.5 Miles
ENERGY STAR Score: 99
Awards
ASHRAE Region VII Technology Award - First Place
The Challenges
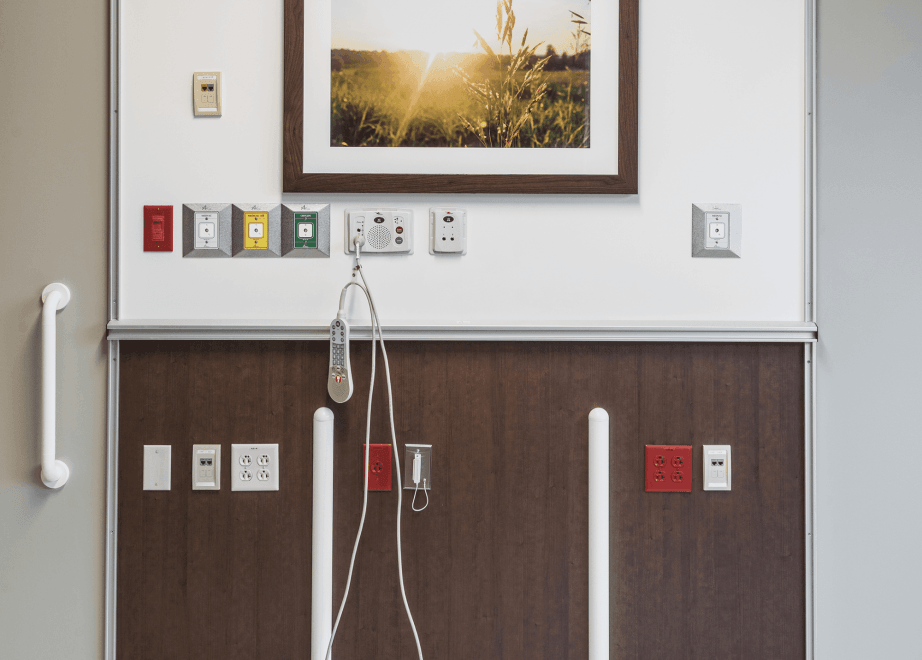
Creating an efficient facility that was flexible, low maintenance and focused on patient comfort.
Operating within a compressed design schedule.
Leading the region in sustainable construction and renovation.
The annual savings enabled Major Hospital to make technological investments and create a highly acclaimed hospital.
Jeff Williams
Vice President of Facility Operations
The Solutions
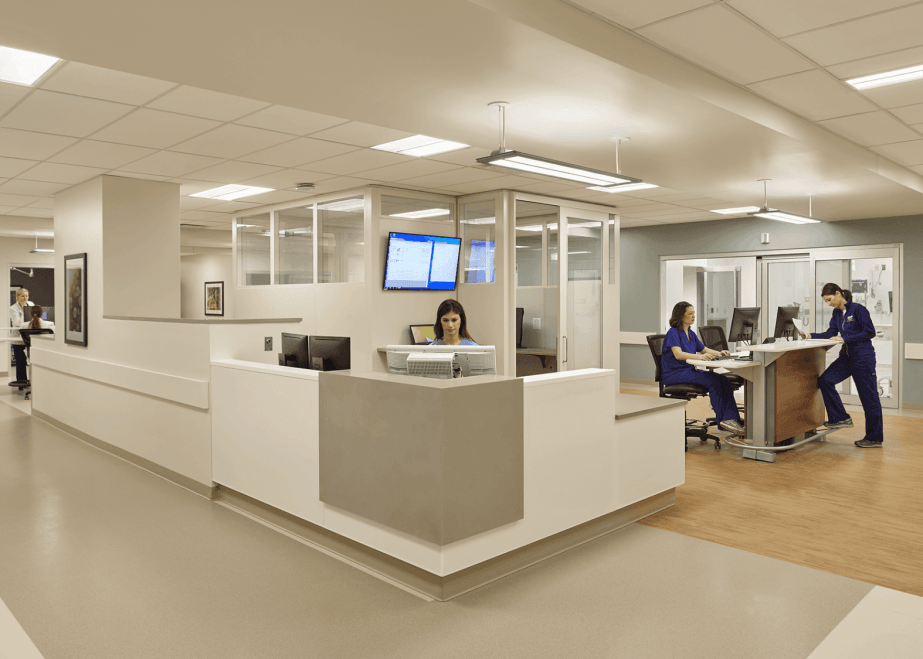
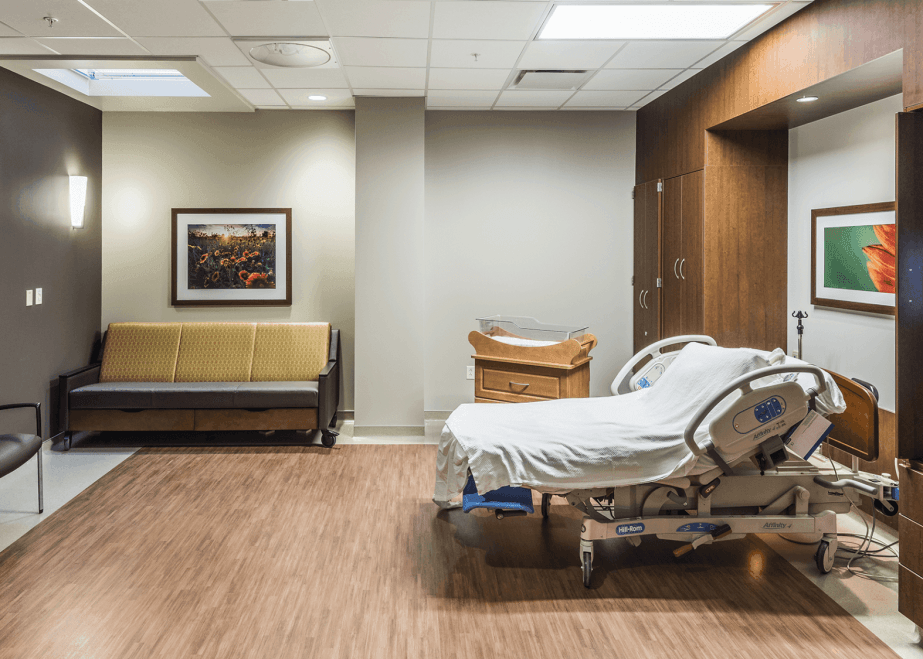
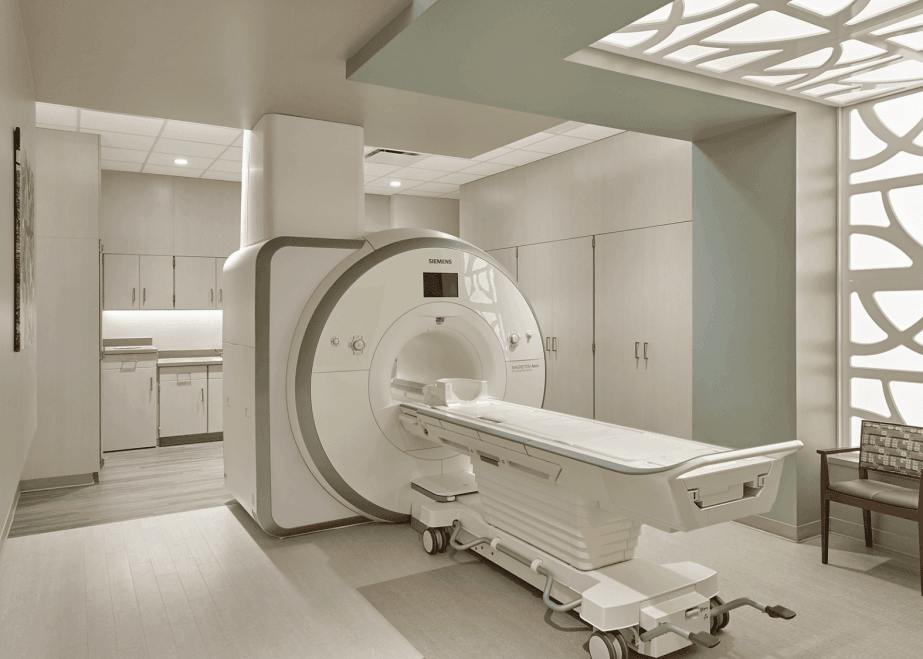
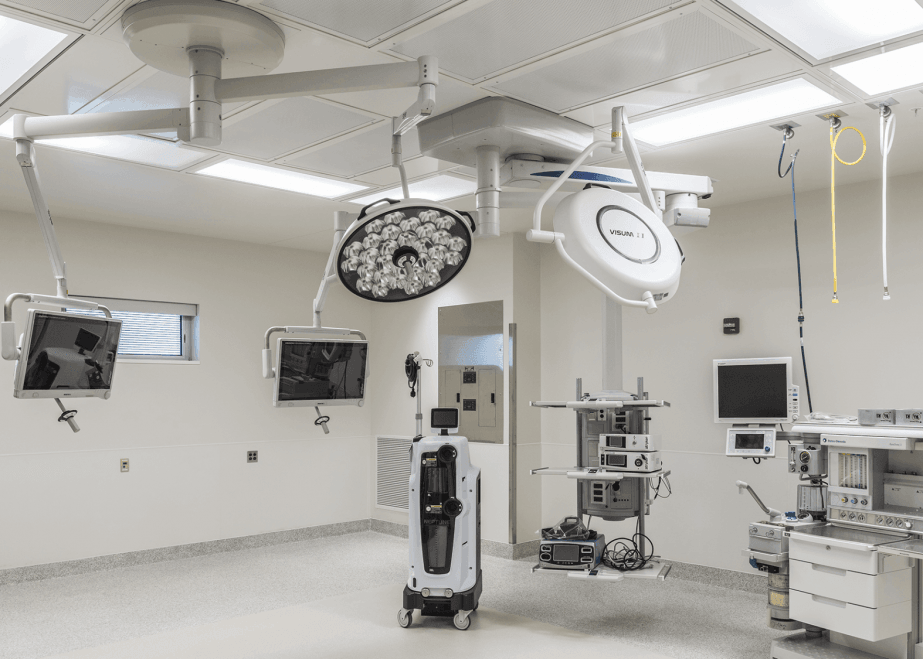
The new 299,000 SF, full-service facility features 32 medical surgical beds, 8 ICU beds, an emergency department, labor and delivery suite, radiology department, and surgical suite. Additionally, the 2nd floor consists of medical office suites and outpatient services, making the hospital a "one stop shop" for patients. Throughout the hospital, “intentional adjacencies” make operations smoother, leading to better care. One example includes positioning the emergency department next to the imaging department in order to position the centralized CT scanner room and accommodate patient flows from both departments.
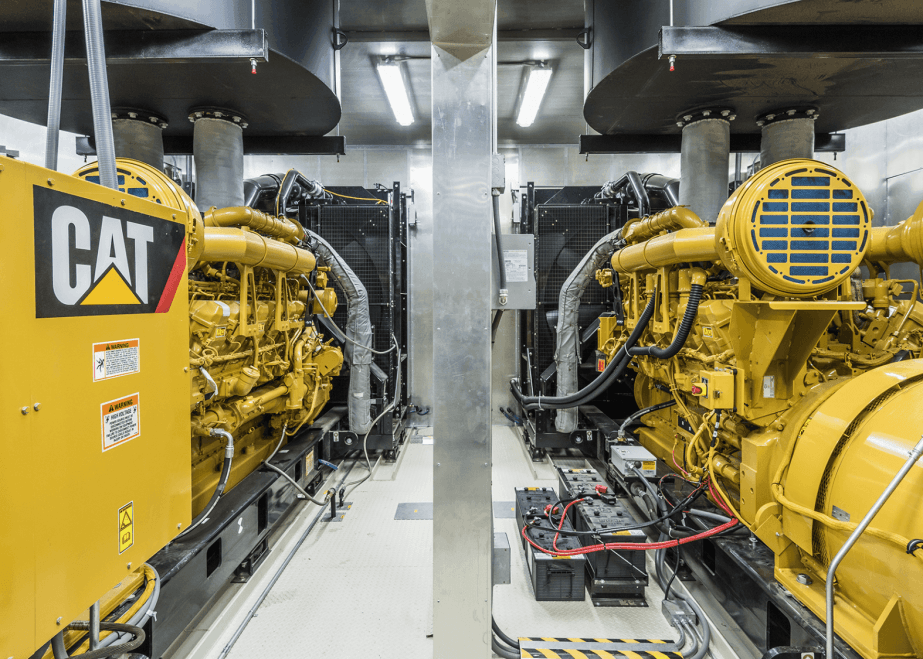
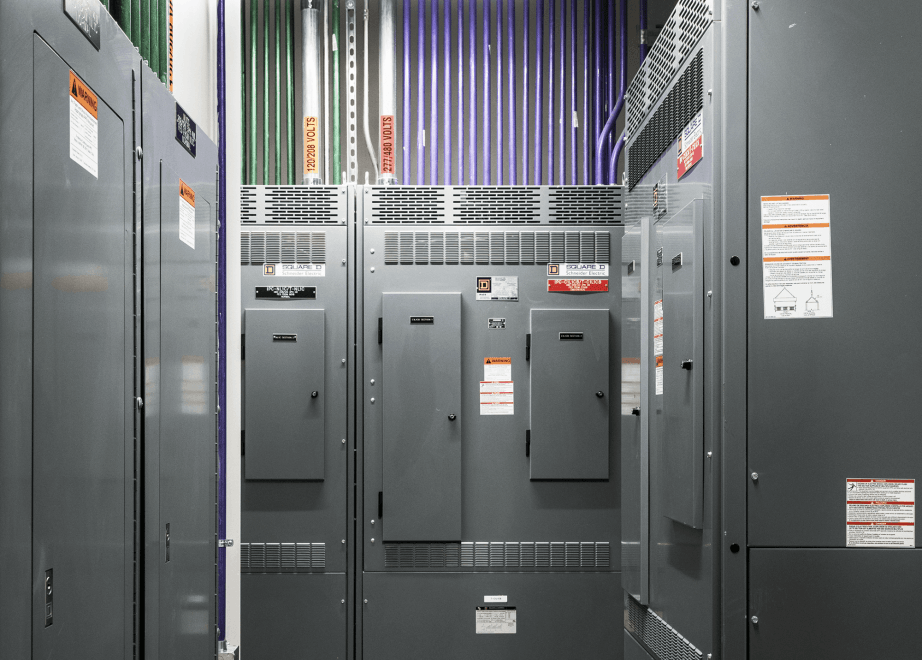
A notable aspect of this project is its electrical distribution system, which is fed from two separate utility circuits. These originate from completely separate utility sub-stations, arriving at the hospital from separate directions. The distribution gear provides automatic switching between these primary feeders if one should fail in the event of a disaster. Furthermore, should both utility feeds become unavailable, the two onsite emergency generators will parallel this dual distribution system and provide power to the entire building—creating energy resilience for the region's hospital.
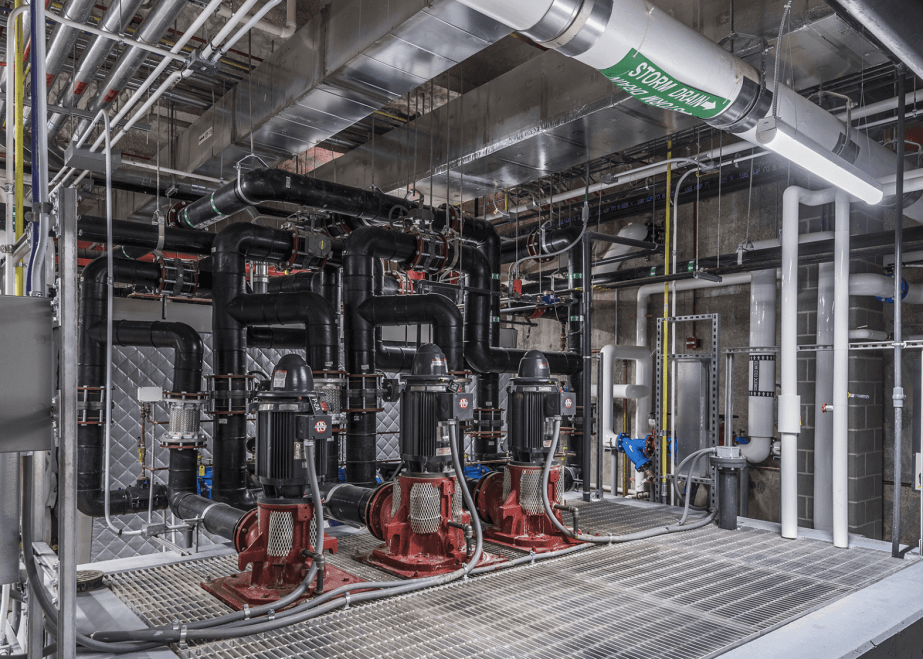
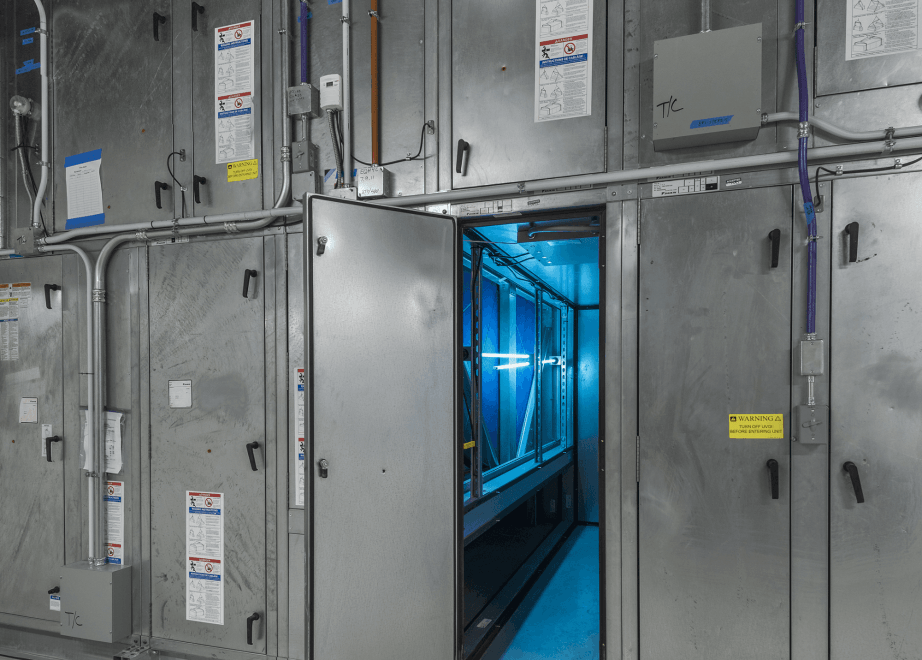
The project featured an innovative addition: a small geothermal system serving the process chilled water for the hospital's linear accelerator and PET-CT machines. The 10, 400-feet-deep well geothermal system not only improves system redundancy, but it also saves Major Health $25,000 annually.
Building Envelope Improvements
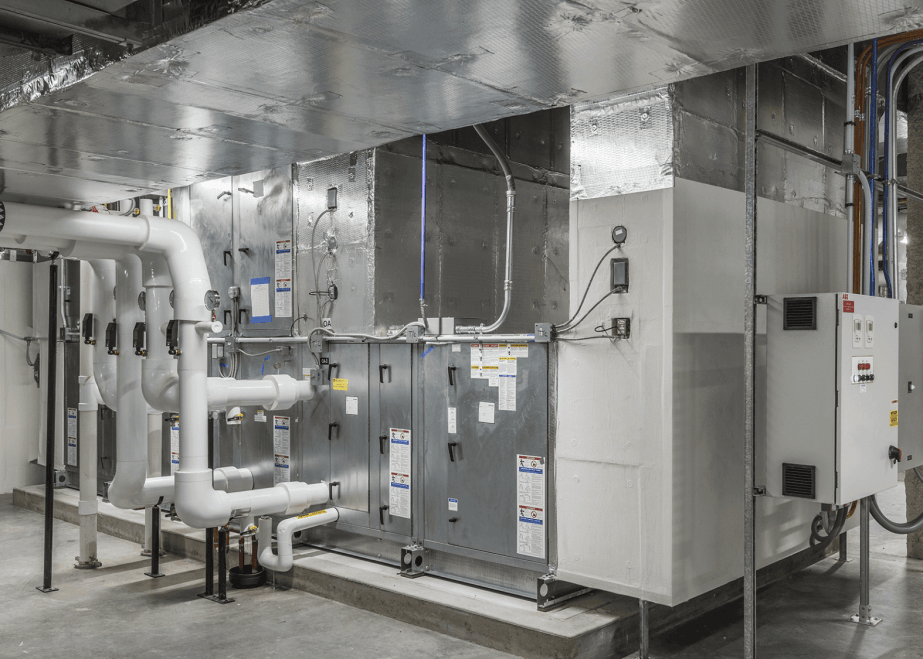
During the project's design phase, CMTA helped MHP select an improved wall system of 3" exterior spray foam. Not only was this decision cost-effective, but it allowed for a reduced chiller and cooling tower size. Other envelope improvements included window tuning. Through the use of glass with improved U values and SHGC, the focus was placed on the South and West exposures to minimize solar loading and subsequently reduce the required HVAC equipment sizes. After construction, a building pressure test was conducted and resulted in a leakage rate of 0.11 cfm/SF.
LED the Way
Another energy efficient feature of the building is the use of LED lighting technology throughout. In fact, 100% of the lighting in Major Hospital is powered by LED, which allows appropriate luminous efficacy and spacing for a hospital environment with a payback period of just 3 years.
The Results
Despite more than doubling the square footage of the old hospital, the new building significantly reduces energy usage. CMTA’s lighting designers were able to achieve a jaw-dropping 0.51 watts per square foot, which is 58% better than the proscribed International Energy Conservation Code for hospitals. Our sustainable design efforts helped Major Hospital achieve an initial Energy Star Rating of 97, putting the facility in the top ten most energy efficient hospitals in the Midwest.
However, the real results of this project are evident in the hospital’s bottom line. Compared to the national average, Major Hospital will generate $266,000 in energy savings each year. These annual savings have enabled Major Hospital to make technological investments, creating a highly acclaimed community hospital.
CMTA provided great energy modeling data to ensure the financial performance of the geothermal system. Now that the system has been in operation for a year, its energy use is extremely low and we are realizing the predicted return on the investment.